# Trading Terminal
## Trading Terminal Overview
The Trading Terminal is a comprehensive interface designed to provide traders with all the necessary tools and information to make informed trading decisions. Here's a detailed breakdown of the features and functionalities included in the Trading Terminal:
***
### **TradingView Chart Integration**
* **Interactive Charting**: The Trading Terminal integrates a TradingView chart, offering a robust and interactive charting experience. This feature allows traders to visualize price movements, draw trendlines, and use a variety of technical analysis tools directly on the chart.
* **Timeframe Selection**: Traders can select from multiple timeframes to analyze price data, shown below:
* **Technical Tools**: The chart is equipped with various technical tools such as indicators, overlays, and drawing tools to assist in technical analysis.
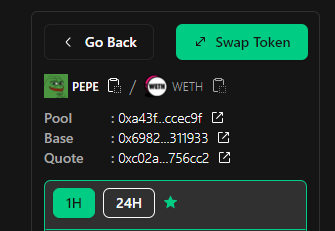
### Swap Tokens Effortlessly!
Users can effortlessly buy or sell tokens directly from the terminal page. The output token is automatically selected based on the specific token terminal page the user is on, enabling seamless and direct access to trading.
### Watchlist, Copy and Explore!
Users have the option to conveniently add tokens to their watchlist by click the ⭐ icon, allowing for easy future access under the watchlist tab. In addition, users can access essential token details, including the token address, native pair address, and liquidity pool pair address. Each of these details can be easily clicked to open in an external explorer for further information. Additionally, users can quickly copy the token address or native pair address by simply clicking the copy icon, making it easier to share or use the information as needed.
**2. Transaction History**
* **Detailed Log**: The transaction history section provides a log of all trades executed within the terminal. This includes details such as the **executing address** and a **transaction hash link** for each trade, enabling users to verify and track transactions on the blockchain.
* **Transparency**: The inclusion of external addresses and transaction hashes ensures complete transparency, allowing traders to audit and verify the trades independently.
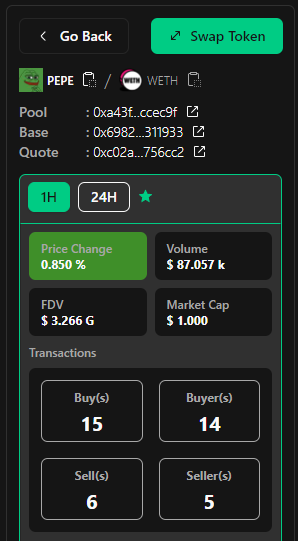
**3. 1-Hour and 24-Hour Data Metrics**
* **Price Change (%)**: Displays the percentage change in price over the last 1 hour and 24 hours.
* **Volume**: Shows the trading volume over the last 1 hour and 24 hours, helping traders gauge market activity and liquidity.
* **Fully Diluted Valuation (FDV)**: Provides a projection of the asset's market cap assuming all tokens are in circulation.
* **Market Cap**: Displays the current market capitalization based on the circulating supply of tokens.
* **Transaction Totals**: Breaks down the total number of buy and sell transactions executed within the last 1 hour and 24 hours.
* **Buyers and Sellers Count**: Provides a count of unique buyers and sellers within the specified timeframes, offering insights into market sentiment and participation.
**4. External Links and Tools**
* **Bubble Maps**: Link to Bubble Maps for visualizing token holder distributions and identifying potential whale activity or concentration of holdings.
* **Twitter/X Search**: Direct link to search for relevant tweets on Twitter/X, helping traders stay updated with the latest news and community sentiment.
* **Banana Bot**: Integration with Banana Bot, a tool used for sniping tokens and such.
* **Bridge**: Quick access to bridge services, facilitating the transfer of tokens across different blockchain networks.
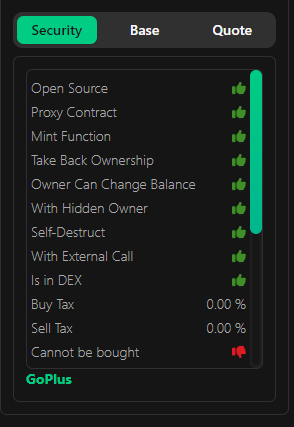
**5. Auto Audit Scanner by GoPlus**
* **Security Scanner**: The terminal includes an auto audit scanner powered by GoPlus, providing real-time security assessments of the tokens and contracts involved in the trades. This tool helps in identifying potential risks and vulnerabilities, offering traders an additional layer of protection.
{% hint style="warning" %}
Please note that all automated audit scanners are not 100% accurate. It is important to conduct your own research and due diligence when it comes to trading. We will not be responsible for any inaccuracies in the information provided by these tools.
{% endhint %}